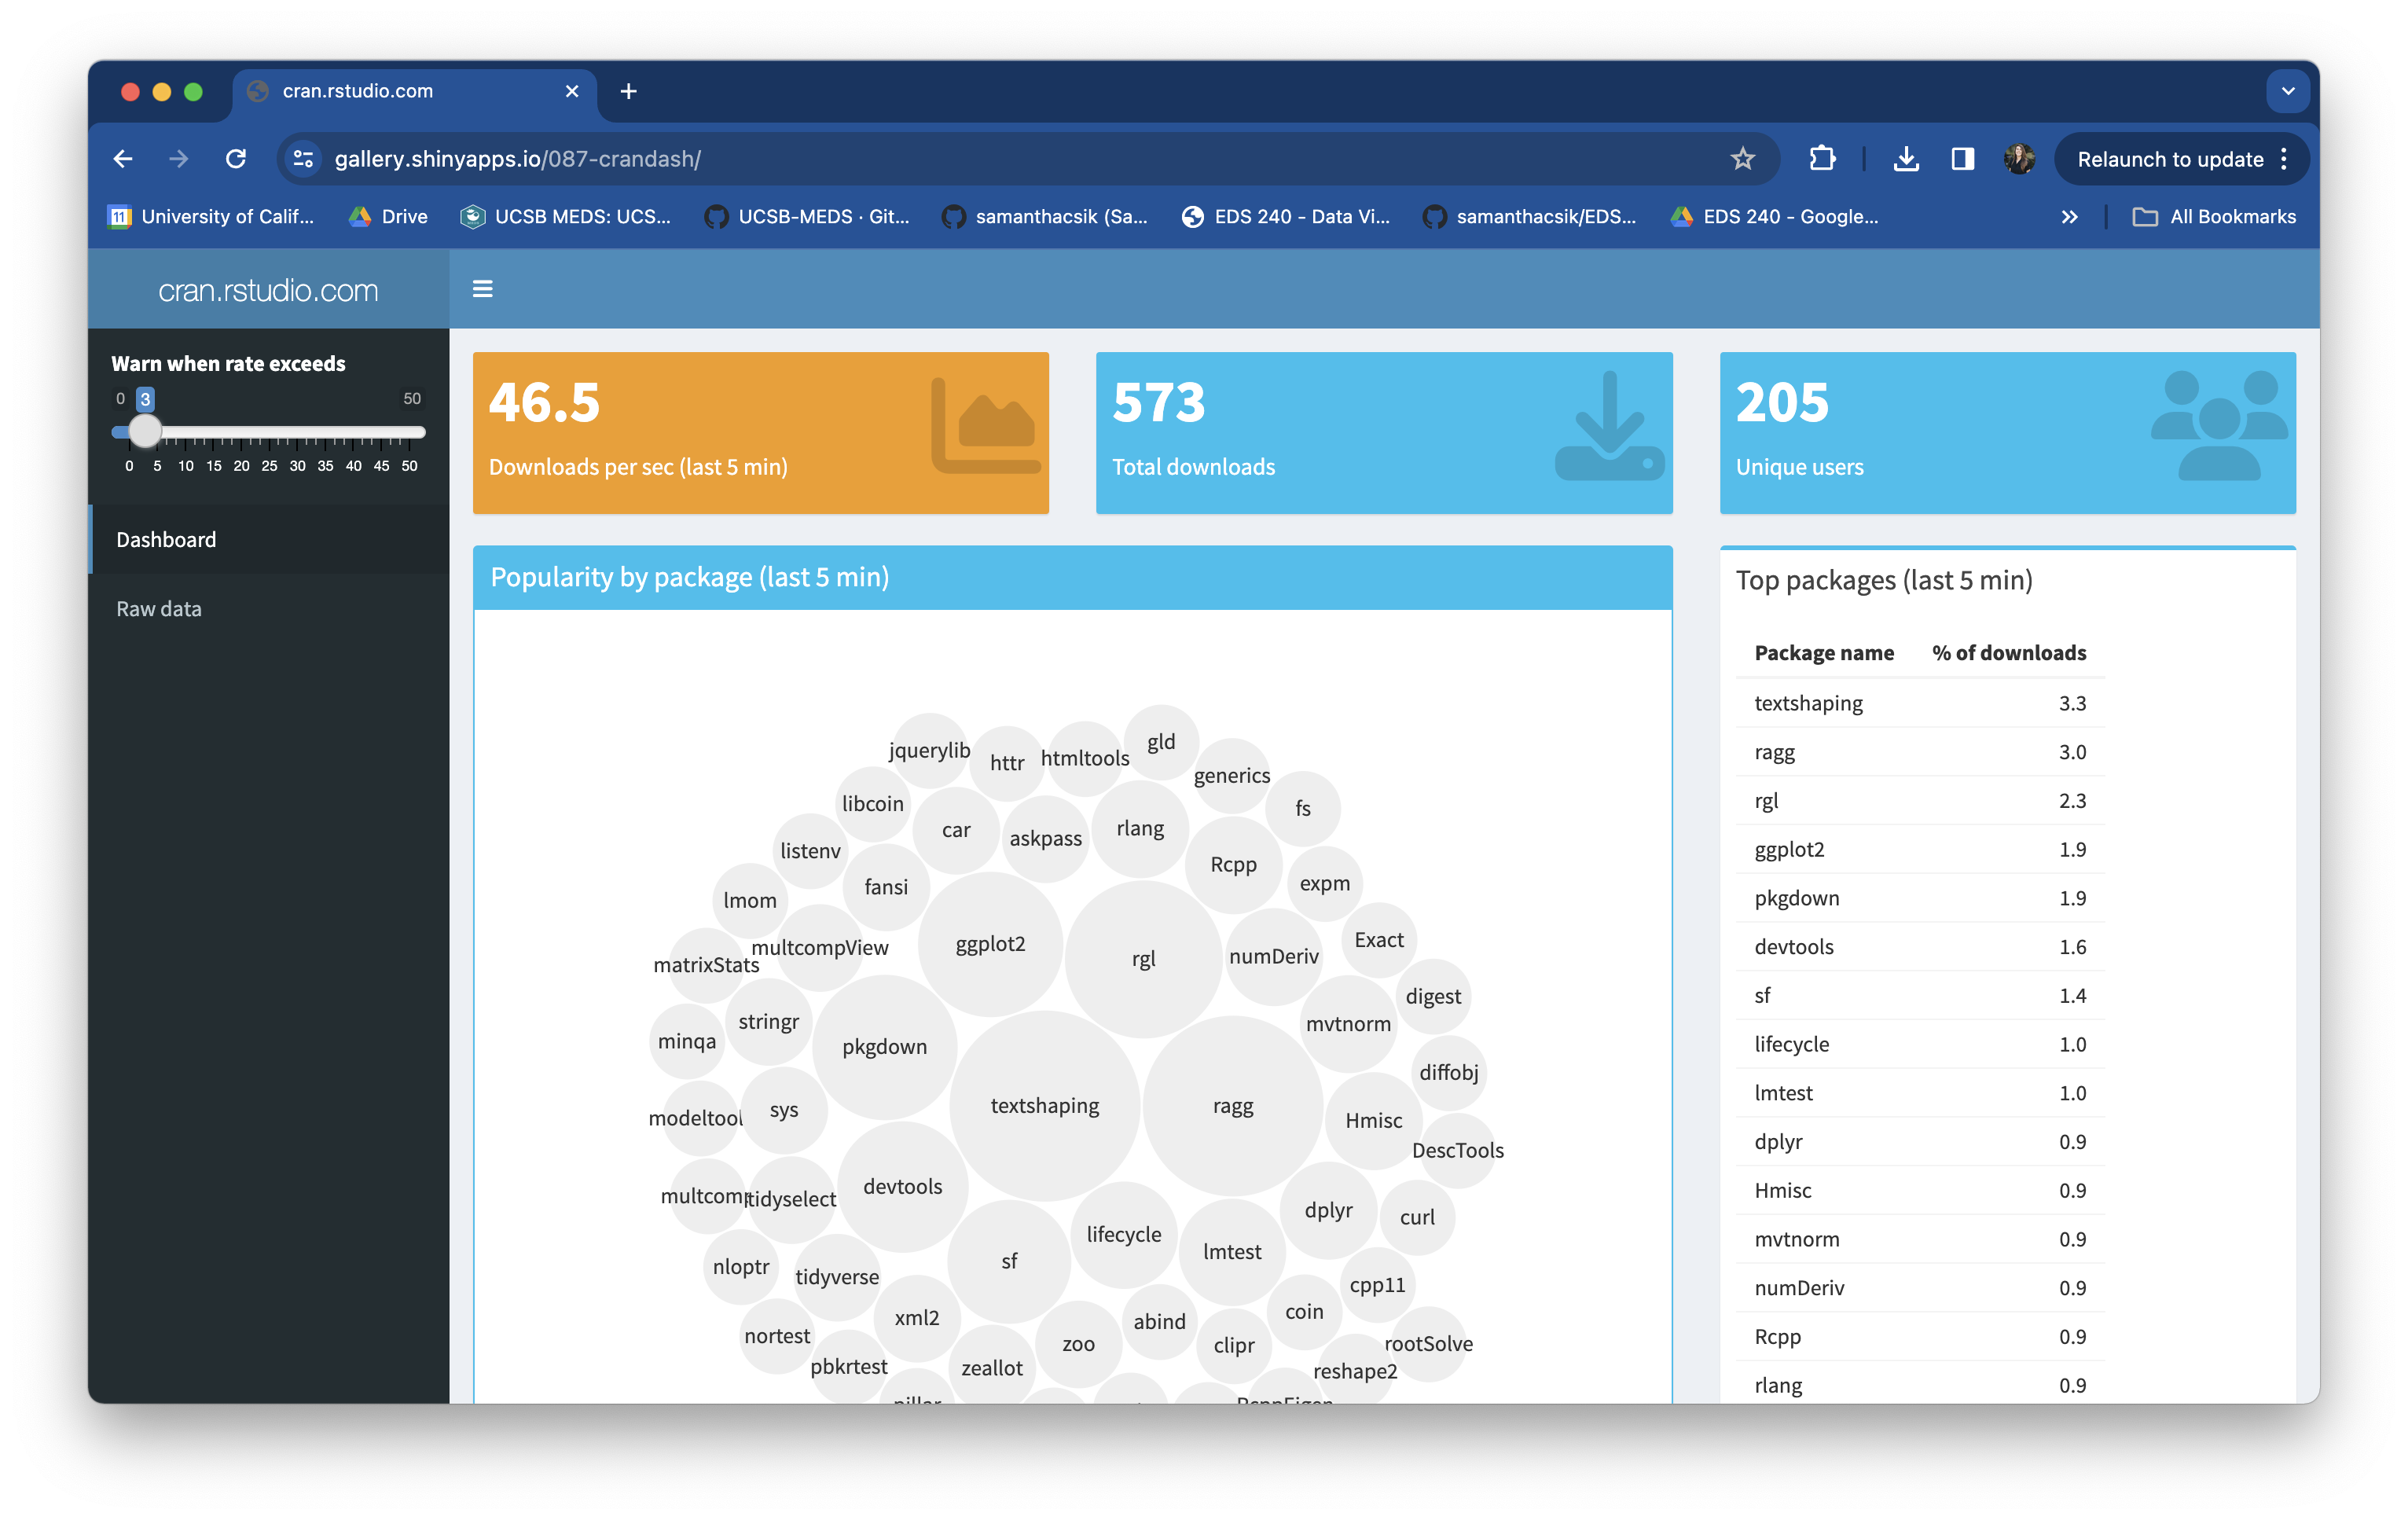
An example shinydashboard which displays streaming data from the RStudio CRAN mirror logs. Explore the dashboard and source code.

Part 3

An example shinydashboard which displays streaming data from the RStudio CRAN mirror logs. Explore the dashboard and source code.
We’ll be using the following R packages:
We’ll be using publicly-available data via the Arctic Data Center for our shiny dashboard.
Christopher Arp, Matthew Whitman, Katie Drew, and Allen Bondurant. 2022. Water depth, surface elevation, and water temperature of lakes in the Fish Creek Watershed in northern Alaska, USA, 2011-2022. Arctic Data Center. doi:10.18739/A2JH3D41P.
Take a few moments to review the metadata record and download FCWO_lakemonitoringdata_2011_2022_daily.csv.
| Lecture slides |
|---|
| Lecture 3: Building Shiny dashboards |