See next slide for an example

EDS 296: Part 7.1
Debugging
Debugging
Like any code, you’re bound to run into errors as you’re developing your shiny app(s). However, Shiny can be particularly challenging to debug. In this section, we’ll review a few approaches for solving pesky issues.
Learning Objectives - Debugging
After this section, you should:
understand some of the challenges associated with debugging shiny applications
know to a few approaches and tools for debugging shiny applications, including using diagnostic messages and the {reactlog} package.
Packages introduced:
{reactlog}: a reactivity visualizer for shiny
Debugging can be challenging
Shiny apps can be particularly challenging to debug for a few reasons:
Shiny is reactive, so code execution isn’t as linear as other code that you’re likely more familiar with (e.g. analytical pipelines written in “normal” R scripts, where each line of code is executed in succession)
Shiny code runs behind a web server and the Shiny framework itself, which can obscure what’s going on
While there are a number of different tools / strategies for debugging Shiny apps, I find myself turning to one (or more) of these approaches most often:
isolating pesky errors (typos, missing commas, unmatched parentheses) in the UI by commenting out code from the outside in
reducing your app to just problematic code by commenting out as much correctly-functioning code as possible
adding diagnostic messages to reactives
using {reactlog} to visualize reactivity errors
We’ll touch on each of these, briefly, but be sure to check out the Shiny article, Debugging Shiny applications and Mastering Shiny Ch. 5.2, by Hadley Wickham, for more approaches, details, and examples.
Track down pesky UI errors by commenting out code from the outside in
Many of us experienced the frustrations of finding unmatched parentheses, typos, missing commas, etc. when building out our UI layout for App #2, and tracking down the issue can require some patience and persistence.
My preferred approach for troubleshooting a situation like this is to comment out all code inside the highest-level layout function (e.g. navbarPage()) > re-run your app to ensure that it works > uncomment the next inner-most pieces > repeat, until you find the place where your app breaks.
See next slide for an example
An example: debugging App #2 by un / commenting
If I were to trouble shoot the UI for App #2, I’d comment out everything except ui <- navbarPage(title = "LTER Animal Data Explorer" and the ending ) # END navbarPage, then run my app to make sure an empty app with a gray navbar and title at the top appears. It does? Great. Next, un-comment the two tabPanel()s that create the “About this App” and “Explore the Data” pages. Works? Add a little bit more back in now, and continue this process. I like to un-comment / re-run all layout function code first, then begin adding back the inputs and outputs one-by-one. See a short, but incomplete demo to the right:

Ultimately, taking your time, adding lots of code comments to mark the ending parentheses of each function, and leaving space between lines of code so that you can more easily see what’s going on will save you lots of headache!
What about “larger” errors?
Oftentimes, you’ll need to identify larger, more complex errors, like why an output isn’t rendering correctly or even appearing in your app at all.
I often turn to two strategies:
(1) commenting out everything except the UI elements and server logic where I believe the issue is stemming from
(2) adding diagnostic messages to my reactives
(3) …and on rare occasions, I’ll try using the {reactlog} package to help visualize my app’s reactivity in an attempt to identify the problem.
To demo these approaches, we’ll use two pre-constructed apps as examples:
(1) working-app (a small app that’s functioning as intended)
(2) broken-app (the same small app that’s not functioning as intended)
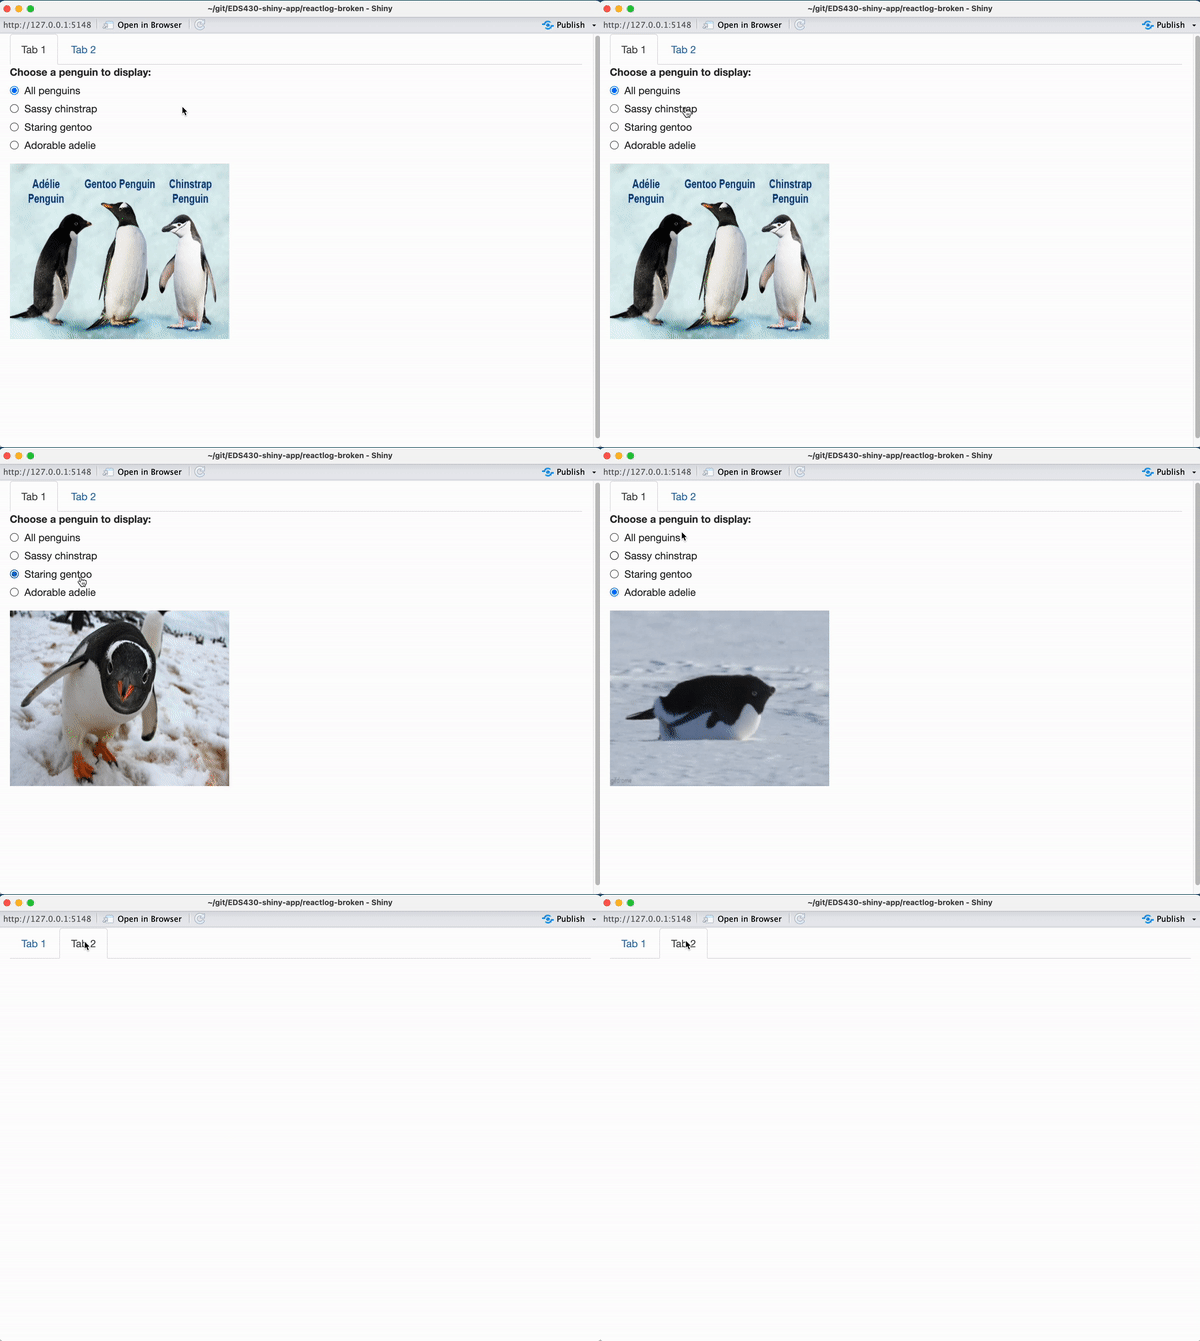
I’m building an app that should look like this…
In Tab 1, both the image and text should update whenever a new radio button is chosen. In Tab 2, the scatterplot should update so that only data points for penguins with body masses within our chosen range are displayed.
. . . but let’s say it actually looks like this:
In Tab 1, only the image updates whenever a new radio button is chosen, and text is missing altogether. In Tab 2, the scatterplot updates as expected whenever the body mass range is changed.
Create both apps in your repo
Create two new subdirectories (one for each of the following apps) and copy the code below into the respective app.R files. You’ll also want to download this www/ folder (containing penguin images) and put a copy of it into each subdirectory:
~/working-app/app.R
# ----- working app -----
# load packages ----
library(shiny)
library(tidyverse)
library(reactlog)
library(palmerpenguins)

# ui ----
ui <- fluidPage(

  tabsetPanel(

    # tab 1 ----
    tabPanel(title = "Tab 1",

             # radio button input ----
             radioButtons(
               inputId = "img_input", label = "Choose a penguin to display:",
               choices = c("All penguins", "Sassy chinstrap", "Staring gentoo", "Adorable adelie"),
               selected = "All penguins"),

             # text output ----
             textOutput(outputId = "penguin_text_output"),

             # img output ----
             imageOutput(outputId = "penguin_img_output")

    ), # END tab 1

    # tab 2 ----
    tabPanel(title = "Tab 2",

             # body mass slider input ----
             sliderInput(inputId = "body_mass_input", label = "Select a range of body masses (g)",
                         min = 2700, max = 6300, value = c(3000, 4000)),

             # body mass plot output ----
             plotOutput(outputId = "body_mass_scatterplot_output")

             ) # END tab 2

  ) # END tabsetPanel

) # END fluidPage


# server ----
server <- function(input, output){

  # render penguin text ----
  output$penguin_text_output <- renderText({

    if(input$img_input == "All penguins"){
      "Meet all of our lovely penguins species!"
    }
    else if(input$img_input == "Sassy chinstrap"){
      "Chinstraps get their name from the thin black line that runs under their chins"
    }
    else if(input$img_input == "Staring gentoo"){
      "Gentoos stand out because of their bright orange bills and feet"
    }
    else if(input$img_input == "Adorable adelie"){
      "Adelie penguins are my personal favorite <3"
    }
  }) # END renderText


  # render penguin images ----
  output$penguin_img_output <- renderImage({

    if(input$img_input == "All penguins"){
      list(src = "www/all_penguins.jpeg", height = 240, width = 300)
    }
    else if(input$img_input == "Sassy chinstrap"){
      list(src = "www/chinstrap.jpeg", height = 240, width = 300)
    }
    else if(input$img_input == "Staring gentoo"){
      list(src = "www/gentoo.jpeg", height = 240, width = 300)
    }
    else if(input$img_input == "Adorable adelie"){
      list(src = "www/adelie.gif", height = 240, width = 300)
    }

  }, deleteFile = FALSE) # END renderImage


  # filter body masses ----
  body_mass_df <- reactive({
    penguins |>
      filter(body_mass_g %in% input$body_mass_input[1]:input$body_mass_input[2])
  }) # END filter body masses


  # render the scatterplot output ----
  output$body_mass_scatterplot_output <- renderPlot({

    ggplot(na.omit(body_mass_df()),
           aes(x = flipper_length_mm, y = bill_length_mm,
               color = species, shape = species)) +
      geom_point() +
      scale_color_manual(values = c("Adelie" = "#FEA346", "Chinstrap" = "#B251F1", "Gentoo" = "#4BA4A4")) +
      scale_shape_manual(values = c("Adelie" = 19, "Chinstrap" = 17, "Gentoo" = 15)) +
      labs(x = "Flipper length (mm)", y = "Bill length (mm)",
           color = "Penguin species", shape = "Penguin species") +
      theme_minimal() +
      theme(legend.position = c(0.85, 0.2),
            legend.background = element_rect(color = "white"))

  }) # END render scatterplot


} # END server

# combine UI & server into an app ----
shinyApp(ui = ui, server = server)
~/broken-app/app.R
# ----- broken app -----
# load packages ----
library(shiny)
library(tidyverse)
library(reactlog)
library(palmerpenguins)

# ui ----
ui <- fluidPage(

  tabsetPanel(

    # tab 1 ----
    tabPanel(title = "Tab 1",

             # radio button input ----
             radioButtons(
               inputId = "img_input", label = "Choose a penguin to display:",
               choices = c("All penguins", "Sassy chinstrap", "Staring gentoo", "Adorable adelie"),
               selected = "All penguins"),

             # text output ----
             textOutput(outputId = "penguin_text_output"),

             # img output ----
             imageOutput(outputId = "penguin_img_output")

    ), # END tab 1

    # tab 2 ----
    tabPanel(title = "Tab 2",

             # body mass slider input ----
             sliderInput(inputId = "body_mass_input", label = "Select a range of body masses (g)",
                         min = 2700, max = 6300, value = c(3000, 4000)),

             # body mass plot output ----
             plotOutput(outputId = "body_mass_scatterplot_output")

    ) # END tab 2

  ) # END tabsetPanel

) # END fluidPage


# server ----
server <- function(input, output){

  # render penguin text ----
  output$penguins_text_output <- renderText({

    if(input$img_input == "All penguins"){
      "Meet all of our lovely penguins species!"
    }
    else if(input$img_input == "Sassy chinstrap"){
      "Chinstraps get their name from the thin black line that runs under their chins"
    }
    else if(input$img_input == "Staring gentoo"){
      "Gentoos stand out because of their bright orange bills and feet"
    }
    else if(input$img_input == "Adorable adelie"){
      "Adelie penguins are my personal favorite <3"
    }
  }) # END renderText


  # render penguin images ----
  output$penguin_img_output <- renderImage({

    if(input$img_input == "All penguins"){
      list(src = "www/all_penguins.jpeg", height = 240, width = 300)
    }
    else if(input$img_input == "Sassy chinstrap"){
      list(src = "www/chinstrap.jpeg", height = 240, width = 300)
    }
    else if(input$img_input == "Staring gentoo"){
      list(src = "www/gentoo.jpeg", height = 240, width = 300)
    }
    else if(input$img_input == "Adorable adelie"){
      list(src = "www/adelie.gif", height = 240, width = 300)
    }

  }, deleteFile = FALSE) # END renderImage


  # filter body masses ----
  body_mass_df <- reactive({
    penguins |>
      filter(body_mass_g %in% input$body_mass_input[1]:input$body_mass_input[2])
  }) # END filter body masses


  # render the scatterplot output ----
  output$body_mass_scatterplot_output <- renderPlot({

    ggplot(na.omit(body_mass_df()),
           aes(x = flipper_length_mm, y = bill_length_mm,
               color = species, shape = species)) +
      geom_point() +
      scale_color_manual(values = c("Adelie" = "#FEA346", "Chinstrap" = "#B251F1", "Gentoo" = "#4BA4A4")) +
      scale_shape_manual(values = c("Adelie" = 19, "Chinstrap" = 17, "Gentoo" = 15)) +
      labs(x = "Flipper length (mm)", y = "Bill length (mm)",
           color = "Penguin species", shape = "Penguin species") +
      theme_minimal() +
      theme(legend.position = c(0.85, 0.2),
            legend.background = element_rect(color = "white"))

  }) # END render scatterplot


} # END server

# combine UI & server into an app ----
shinyApp(ui = ui, server = server)
Start by commenting out functioning code
~/broken-app/app.R
# ----- broken app -----
# load packages ----
library(shiny)
library(tidyverse)
library(reactlog)
library(palmerpenguins)

# ui ----
ui <- fluidPage(

  tabsetPanel(

    # tab 1 ----
    tabPanel(title = "Tab 1",

             # radio button input ----
             radioButtons(
               inputId = "img_input", label = "Choose a penguin to display:",
               choices = c("All penguins", "Sassy chinstrap", "Staring gentoo", "Adorable adelie"),
               selected = "All penguins"),

             # text output ----
             textOutput(outputId = "penguin_text_output"),

             # img output ----
             imageOutput(outputId = "penguin_img_output")

    ), # END tab 1

    # tab 2 ----
    tabPanel(title = "Tab 2"#,

             # # body mass slider input ----
             # sliderInput(inputId = "body_mass_input", label = "Select a range of body masses (g)",
             #             min = 2700, max = 6300, value = c(3000, 4000)),

             # # body mass plot output ----
             # plotOutput(outputId = "body_mass_scatterplot_output")

    ) # END tab 2

  ) # END tabsetPanel

) # END fluidPage


# server ----
server <- function(input, output){

  # render penguin text ----
  output$penguins_text_output <- renderText({

    if(input$img_input == "All penguins"){
      "Meet all of our lovely penguins species!"
    }
    else if(input$img_input == "Sassy chinstrap"){
      "Chinstraps get their name from the thin black line that runs under their chins"
    }
    else if(input$img_input == "Staring gentoo"){
      "Gentoos stand out because of their bright orange bills and feet"
    }
    else if(input$img_input == "Adorable adelie"){
      "Adelie penguins are my personal favorite <3"
    }
  }) # END renderText


  # render penguin images ----
  output$penguin_img_output <- renderImage({

    if(input$img_input == "All penguins"){
      list(src = "www/all_penguins.jpeg", height = 240, width = 300)
    }
    else if(input$img_input == "Sassy chinstrap"){
      list(src = "www/chinstrap.jpeg", height = 240, width = 300)
    }
    else if(input$img_input == "Staring gentoo"){
      list(src = "www/gentoo.jpeg", height = 240, width = 300)
    }
    else if(input$img_input == "Adorable adelie"){
      list(src = "www/adelie.gif", height = 240, width = 300)
    }

  }, deleteFile = FALSE) # END renderImage


  # # filter body masses ----
  # body_mass_df <- reactive({
  #   penguins |>
  #     filter(body_mass_g %in% input$body_mass_input[1]:input$body_mass_input[2])
  # }) # END filter body masses


  # # render the scatterplot output ----
  # output$body_mass_scatterplot_output <- renderPlot({
  #
  #   ggplot(na.omit(body_mass_df()),
  #          aes(x = flipper_length_mm, y = bill_length_mm,
  #              color = species, shape = species)) +
  #     geom_point() +
  #     scale_color_manual(values = c("Adelie" = "#FEA346", "Chinstrap" = "#B251F1", "Gentoo" = "#4BA4A4")) +
  #     scale_shape_manual(values = c("Adelie" = 19, "Chinstrap" = 17, "Gentoo" = 15)) +
  #     labs(x = "Flipper length (mm)", y = "Bill length (mm)",
  #          color = "Penguin species", shape = "Penguin species") +
  #     theme_minimal() +
  #     theme(legend.position = c(0.85, 0.2),
  #           legend.background = element_rect(color = "white"))
  #
  # }) # END render scatterplot


} # END server

# combine UI & server into an app ----
shinyApp(ui = ui, server = server)
Next, add messages to your reactives
You can insert diagnostic messages within your reactives using message() – here, we’ll add a short message where each text and image output should be rendered.
~/broken-app/app.R
# load packages ----
library(shiny)
library(tidyverse)
library(reactlog)
library(palmerpenguins)

# ui ----
ui <- fluidPage(

  tabsetPanel(

    # tab 1 ----
    tabPanel(title = "Tab 1",

             # radio button input ----
             radioButtons(
               inputId = "img_input", label = "Choose a penguin to display:",
               choices = c("All penguins", "Sassy chinstrap", "Staring gentoo", "Adorable adelie"),
               selected = "All penguins"),

             # text output ----
             textOutput(outputId = "penguin_text_output"),

             # img output ----
             imageOutput(outputId = "penguin_img_output")

    ), # END tab 1

    # tab 2 ----
    tabPanel(title = "Tab 2"#,

             # # body mass slider input ----
             # sliderInput(inputId = "body_mass_input", label = "Select a range of body masses (g)",
             #             min = 2700, max = 6300, value = c(3000, 4000)),

             # # body mass plot output ----
             # plotOutput(outputId = "body_mass_scatterplot_output")

    ) # END tab 2

  ) # END tabsetPanel

) # END fluidPage


# server ----
server <- function(input, output){

  # render penguin text ----
  output$penguins_text_output <- renderText({

    if(input$img_input == "All penguins"){
      message("Printing all penguins text")
      "Meet all of our lovely penguins species!"
    }
    else if(input$img_input == "Sassy chinstrap"){
      message("Printing chinstrap text")
      "Chinstraps get their name from the thin black line that runs under their chins"
    }
    else if(input$img_input == "Staring gentoo"){
      message("Printing gentoo text")
      "Gentoos stand out because of their bright orange bills and feet"
    }
    else if(input$img_input == "Adorable adelie"){
      message("Printing adelie text")
      "Adelie penguins are my personal favorite <3"
    }
  }) # END renderText


  # render penguin images ----
  output$penguin_img_output <- renderImage({

    if(input$img_input == "All penguins"){
      message("Displaying all penguins image")
      list(src = "www/all_penguins.jpeg", height = 240, width = 300)
    }
    else if(input$img_input == "Sassy chinstrap"){
      message("Displaying chinstrap image")
      list(src = "www/chinstrap.jpeg", height = 240, width = 300)
    }
    else if(input$img_input == "Staring gentoo"){
      message("Displaying gentoo image")
      list(src = "www/gentoo.jpeg", height = 240, width = 300)
    }
    else if(input$img_input == "Adorable adelie"){
      message("Displaying adelie image")
      list(src = "www/adelie.gif", height = 240, width = 300)
    }

  }, deleteFile = FALSE) # END renderImage


  # # filter body masses ----
  # body_mass_df <- reactive({
  #   penguins |>
  #     filter(body_mass_g %in% input$body_mass_input[1]:input$body_mass_input[2])
  # }) # END filter body masses


  # # render the scatterplot output ----
  # output$body_mass_scatterplot_output <- renderPlot({
  #
  #   ggplot(na.omit(body_mass_df()),
  #          aes(x = flipper_length_mm, y = bill_length_mm,
  #              color = species, shape = species)) +
  #     geom_point() +
  #     scale_color_manual(values = c("Adelie" = "#FEA346", "Chinstrap" = "#B251F1", "Gentoo" = "#4BA4A4")) +
  #     scale_shape_manual(values = c("Adelie" = 19, "Chinstrap" = 17, "Gentoo" = 15)) +
  #     labs(x = "Flipper length (mm)", y = "Bill length (mm)",
  #          color = "Penguin species", shape = "Penguin species") +
  #     theme_minimal() +
  #     theme(legend.position = c(0.85, 0.2),
  #           legend.background = element_rect(color = "white"))
  #
  # }) # END render scatterplot


} # END server

# combine UI & server into an app ----
shinyApp(ui = ui, server = server)
See which messages successfully print
We can run our app and see messages successfully (or in the case of a broken app, unsuccessfully) print in the RStudio console as we interact with the app. You’ll notice that the each image message (e.g. “Displaying all penguins image”) prints when a new radioButton is selected, but those associated with the text outputs do not. This tells us that code is not being executed, beginning with first if statement inside renderText() and that this is a good starting location for reviewing code (e.g. carefully crosschecking all inputIds and outputIds in that section).
If helpful, use {reactlog} to visualize reactivity
reactlog is a package / tool that provides:
“A snapshot of the history (log) of all reactive interactions within a shiny application” - Barret Schloerke in his 2019 RSTUDIO::CONF talk, Reactlog 2.0: Debugging the state of Shiny

Reactivity can be confusing. I recommend watching Barret Schloerke’s talk, linked above, and reading through the Shiny Reactlog vignette as you get started.
Using {reactlog}
{reactlog} should already be installed as a dependency of {shiny} (but you’ll need to load it using library(reactlog) in your console). When enabled, it provides an interactive browser-based tool to visualize reactive dependencies and executions in your app.
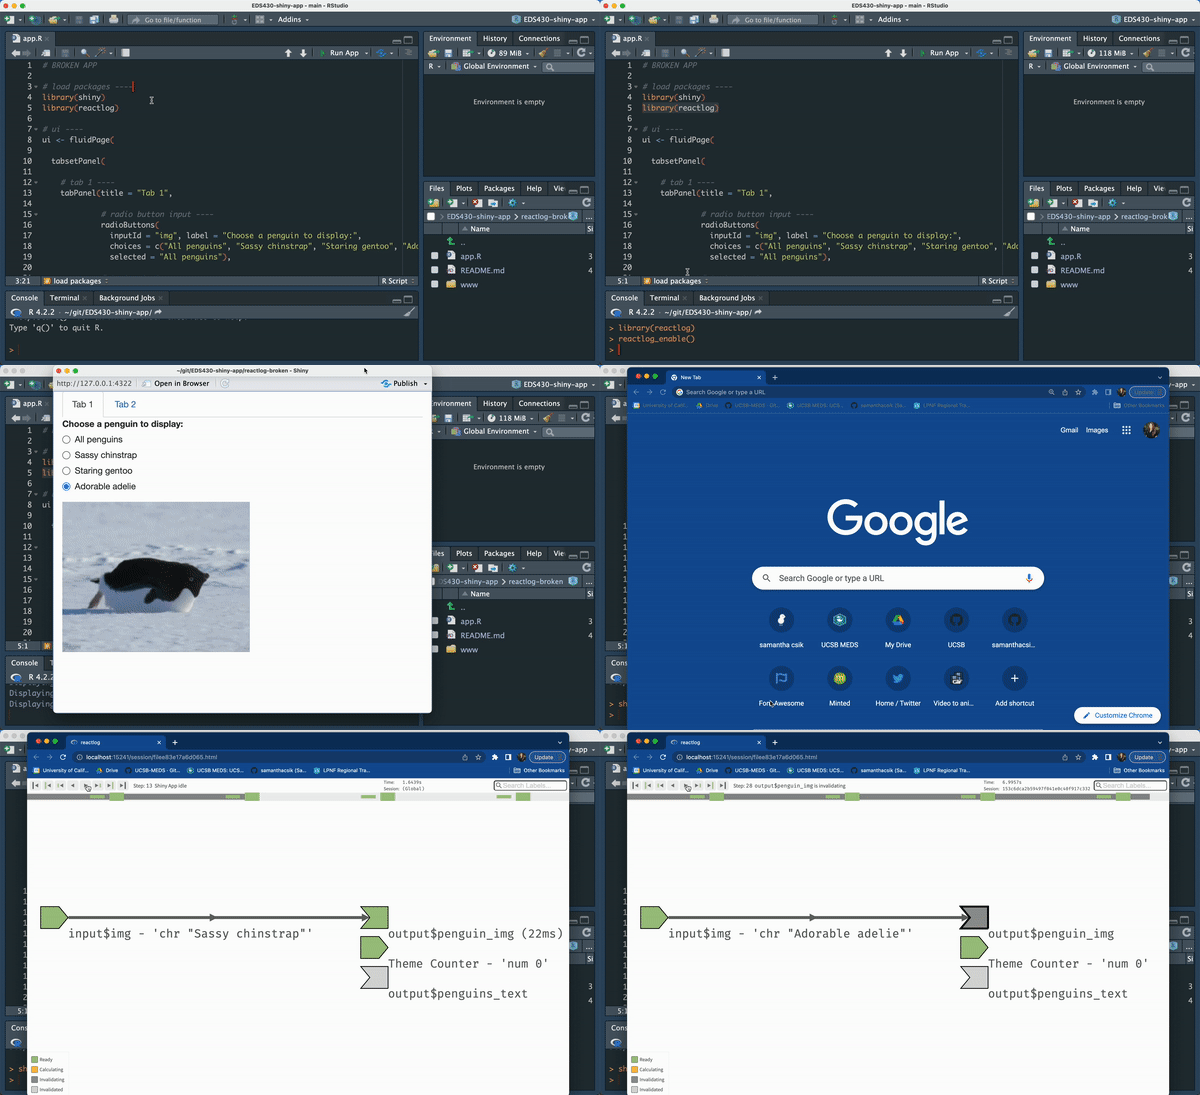
To use reactlog, follow these steps:
(1) Load the reactlog library in you console (library(reactlog))
(2) Call reactlog_enable() in your console
(3) Run your app, interact with it, then quit your app
(4) Launch reactlog by running shiny::reactlogShow() in your console (or use the keyboard shortcut cmd/ctrl + F3)
(5) Use your <- and -> arrow keys (or  and
and  ) to move forward and backward through your app’s reactive life cycle
Read about the components of the status bar{target=“_blank} and the meaning of different reactive states in the reactlog vignette.
Using {reactlog} to visualize reactivity in a correctly-functioning app
To visualize the reactive life cycle of the reactlog-working app, let’s perform the following steps:
{reactlog} library in our console, by running library(reactlog)reactlog_enable() in our consoleshiny::reactlogShow() in the console to open the reactlog visualizer in a browser window

Note: We’ve left the scatter plot on Tab 2 (and it’s related UI elements) commented out (as we practiced in the earlier few slides) for this demo – the {reactlog} package has many features that allow you to explore reactive dependencies across your whole app, but it can get complicated quickly. For demo purposes, we’re going to work with this “smaller” version of our app, which contains just the problematic code.]{.body-text-s}
Interpreting {reactlog} (used with our correctly-functioning app)
There’s a lot to take when looking at the reactlog viewer, so let’s take it one step at a time (click your right arrow key to advance steps in the viewer):
(1) The radioButton input defaults to show the All penguins image and associated text. When we launch reactlog, our input  , reactive expression
  , and outputs
  are Ready, meaning the calculated values are available (defaults in this case) and reactive elements have finished executing (i.e. the image and text is displayed). This Ready state is indicated by the green icons.
(2) I (the user) then updated the input by choosing Sassy chinstrap, invalidating (i.e. resetting) the input and thereby invalidating any dependencies – in this case both the image and text outputs. This Invalidating state is indicated by the gray icons.
(3) Once all dependencies are invalidated, the reactive elements can begin Calculating (i.e. executing) based on the new input (Sassy chinstrap). Elements are colored yellow when they are being calculated, then green when calculations are complete and the reactive element has been updated. In this example, first the image and then the text are calculated and updated.
(4) These same steps are repeated when I select the Staring gentoo, then Adorable adelie radioButtons
Using {reactlog} to visualize reactivity in a broken app
Let’s try out reactlog on our intentionally broken app (reactlog-broken, where our image changes when a radioButton user input is updated, but our text doesn’t appear). As in our functioning app, the All penguins image is selected by default. For demonstration purposes, let’s select each option moving down the list (Sassy chinstrap, Staring gentoo, Adorable adelie) before launching the reactlog browser view (using shiny::reactlogShow()).
Similar to our functioning app, the default input, All penguins, and image output are Ready (green). However, in this example our text output is not a dependency of our application’s input – there’s no linkage and the text output is Invalidated (gray).
As we click down the list of radioButtons, the image output is invalidated, then updated accordingly, but the text output remains disconnected from our input.

So what’s the issue with our app?
Evidence from our diagnostic messages and reactlog suggests that we should make sure that our UI and server are actually able to communicate about our desired text output. After careful inspection of our textOutput() and renderText() code, we find that a spelling error is to blame:
Our outputId in the UI is set to penguin_text_output:
But we call penguins_text_output (note the plural) when rendering our output in the server:
By updating our outputId to match in both the UI and the server, we fix our app.
End part 7.1
Up next: testing
05:00
Start by commenting out functioning code
Even though this is a relatively small / simple app, there is still code that, for lack of a better term, gets in the way.
After a quick assessment, my reactive scatterplot on Tab 2 appears to be working as expected. To help simplify the amount of code I need to look at, I’ll start by commenting out all UI elements (
sliderInput&plotOutput) and server logic for the scatterplot.Note: As you begin building more complex apps, you may have reactives that depend on other reactives – it’s important to think about these dependencies when commenting out parts of your app for debugging purposes.
See next slide for code