EDS 430: Part 1.1

What is Shiny?


What is Shiny?

Think interactive web pages built by people who love to code in R (i.e. hopefully many of you!), no JavaScript experience necessary.

Shiny makes building web apps easy


“Shiny is an open source R package that provides an elegant and powerful web framework for building web applications using R. Shiny helps you turn your analyses into interactive web applications without requiring HTML, CSS, or JavaScript knowledge.”

-Posit


A gif of Andre Duarte's 'Worldbank-Shiny' app. On the lefthand side of the app, the title 'Gapminder Interactive Plot' sits above a series of three widgets. The first is a dropdown menu where the user can select a region (e.g. Europe & Central Asia) or view all regions at the same time. The next two widgets are slider inputs -- the first allows the user to select a year between 1960 and 2014, and the second allows the user to select a population size between 500 and 5000. On the right hand side of the app is a bubble plot of Fertility Rate vs. Life Expectancy, which updates as inputs are changed by the user. Hovering a bubble displays thge corresponding Country, Region, Population, Life Expectancy, and Fertility Rate.

Worldbank-Shiny app to visualize fertility rate vs. life expectancy from 1960 to 2015, by Andre Duarte

What’s a framework?


A programming framework (like Shiny) is a set of tools that provide ready-made components and / or solutions for development.


  • Frameworks serve as a foundation so that you don’t need to start development entirely from scratch. They are a starting point for you to add the higher-level functionality that actually makes your software work.

  • Frameworks are often opinionated, meaning you need to follow the rules / structure of the framework.

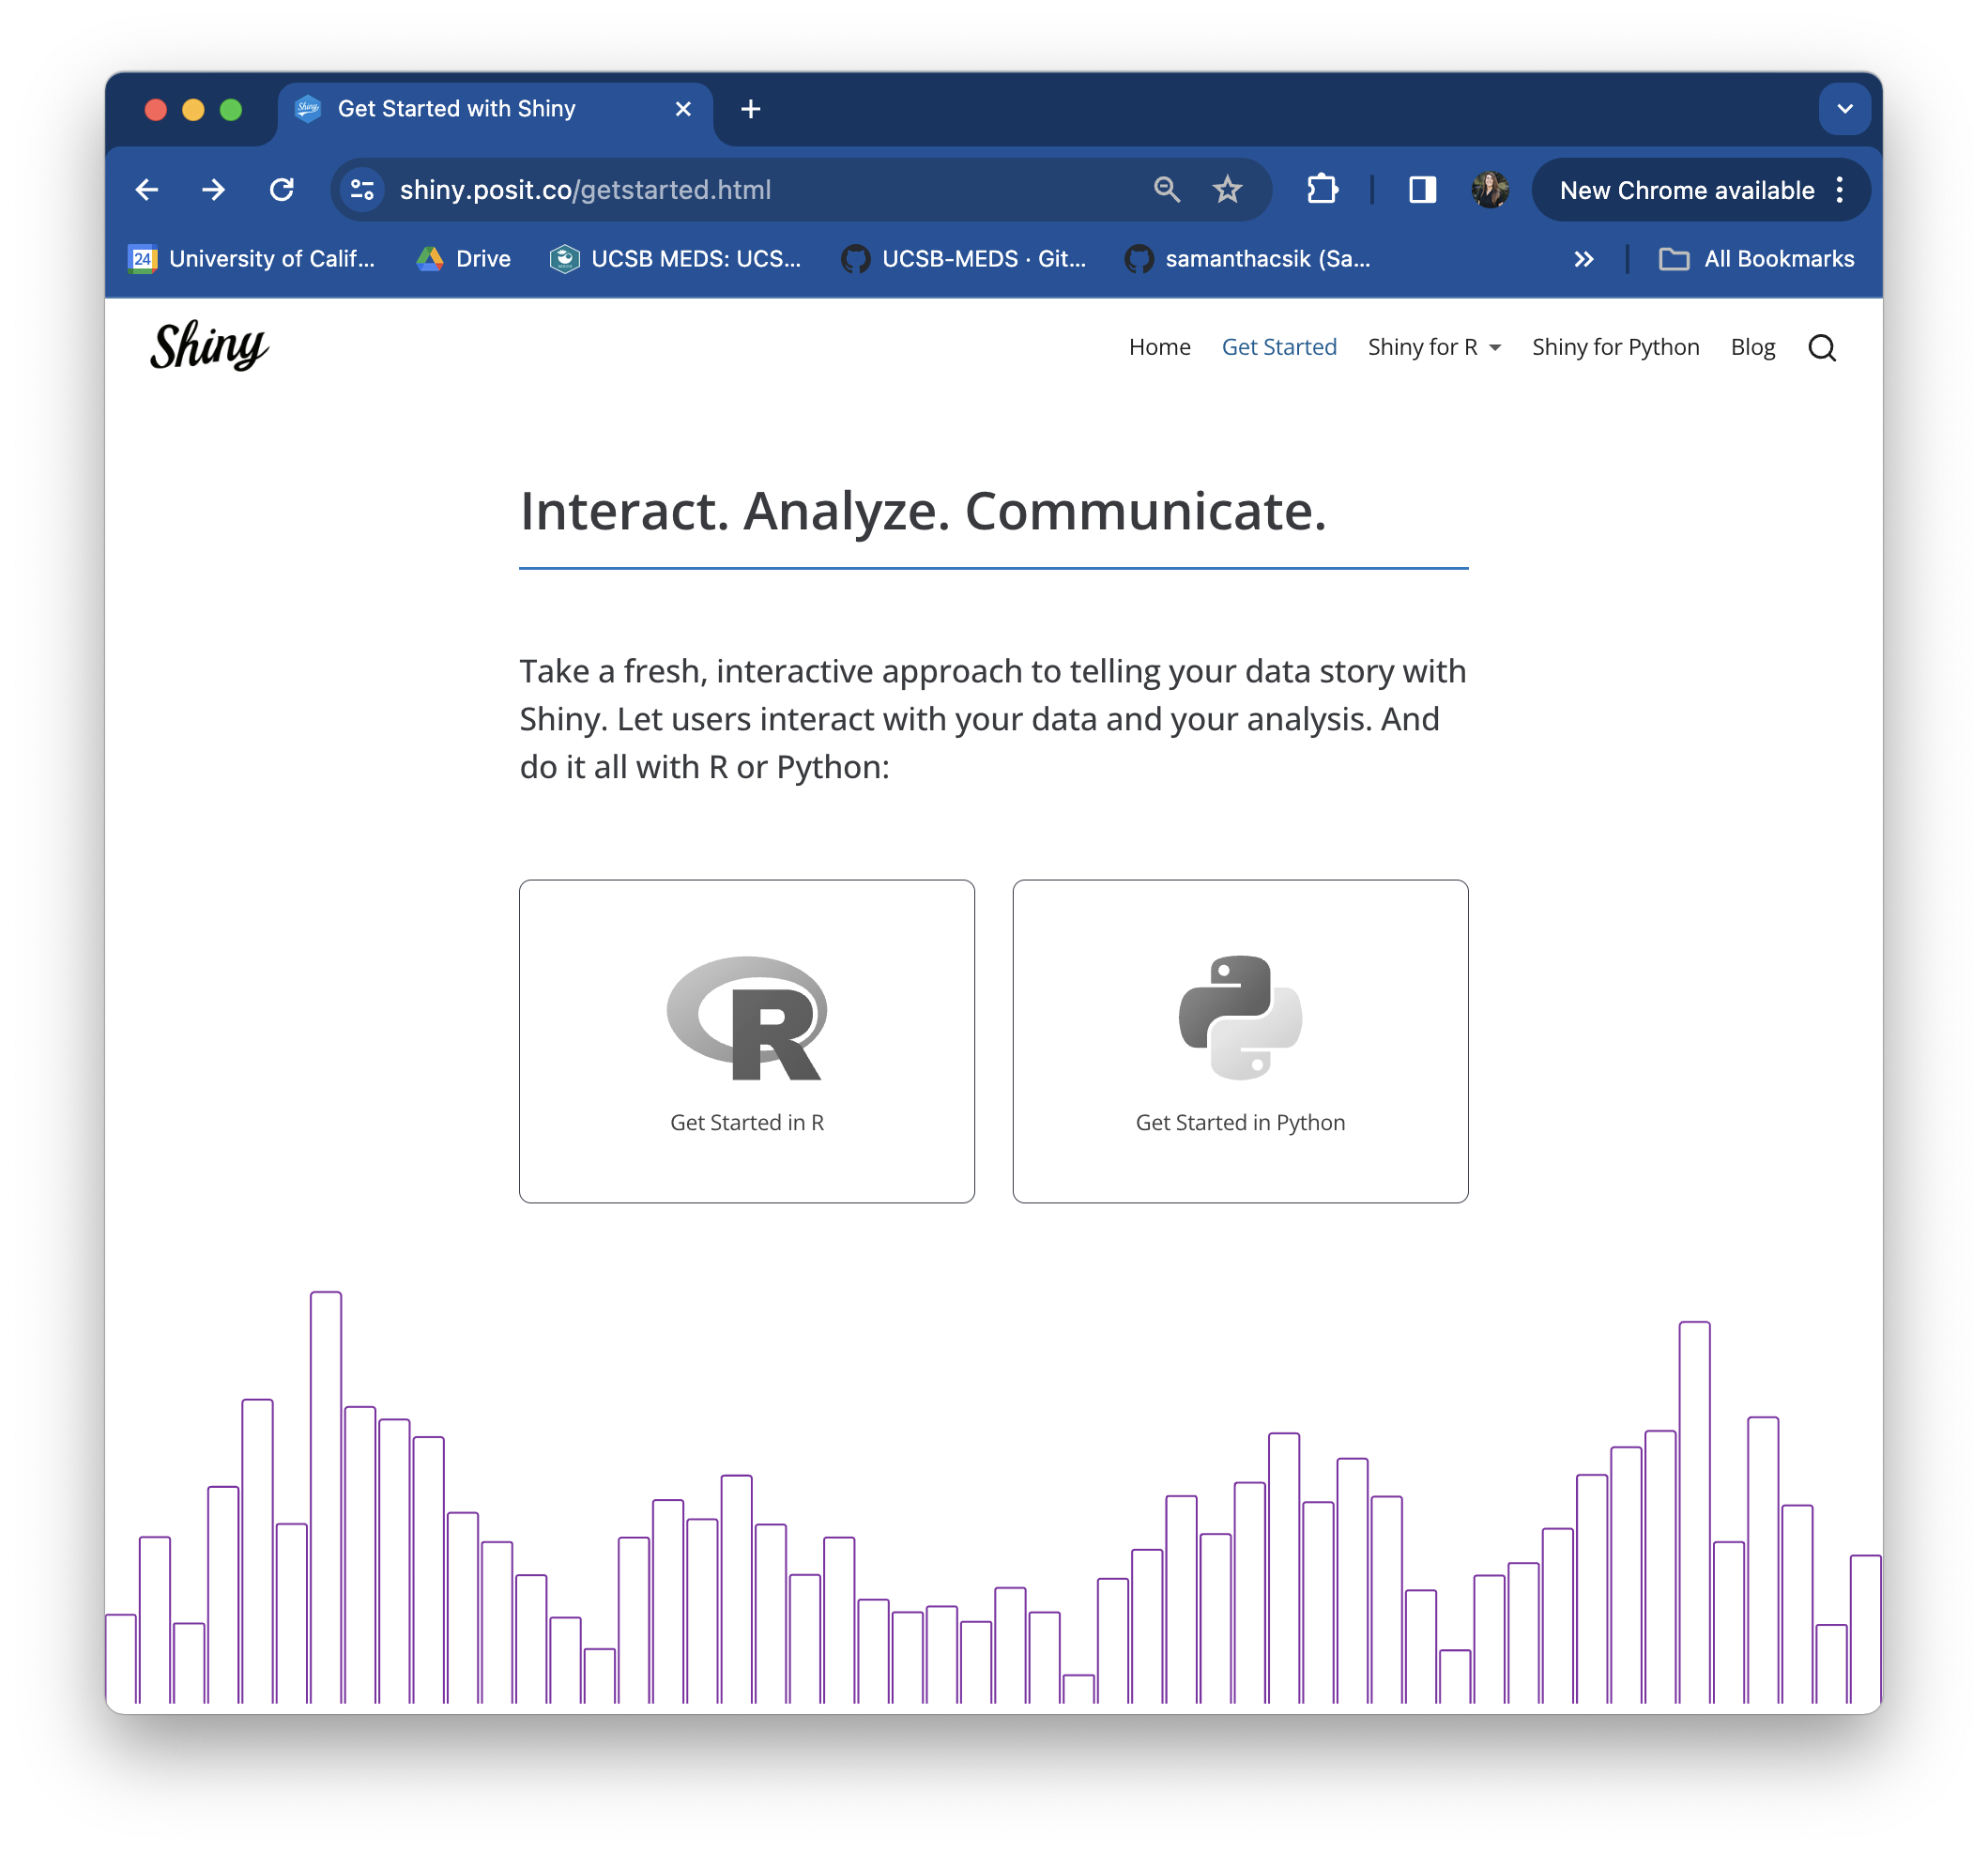
  • Use the Shiny framework for developing apps / dashboards in R or Python

The anatomy of a Shiny app

What does a Shiny app look like under the hood?

The basic anatomy of a Shiny app


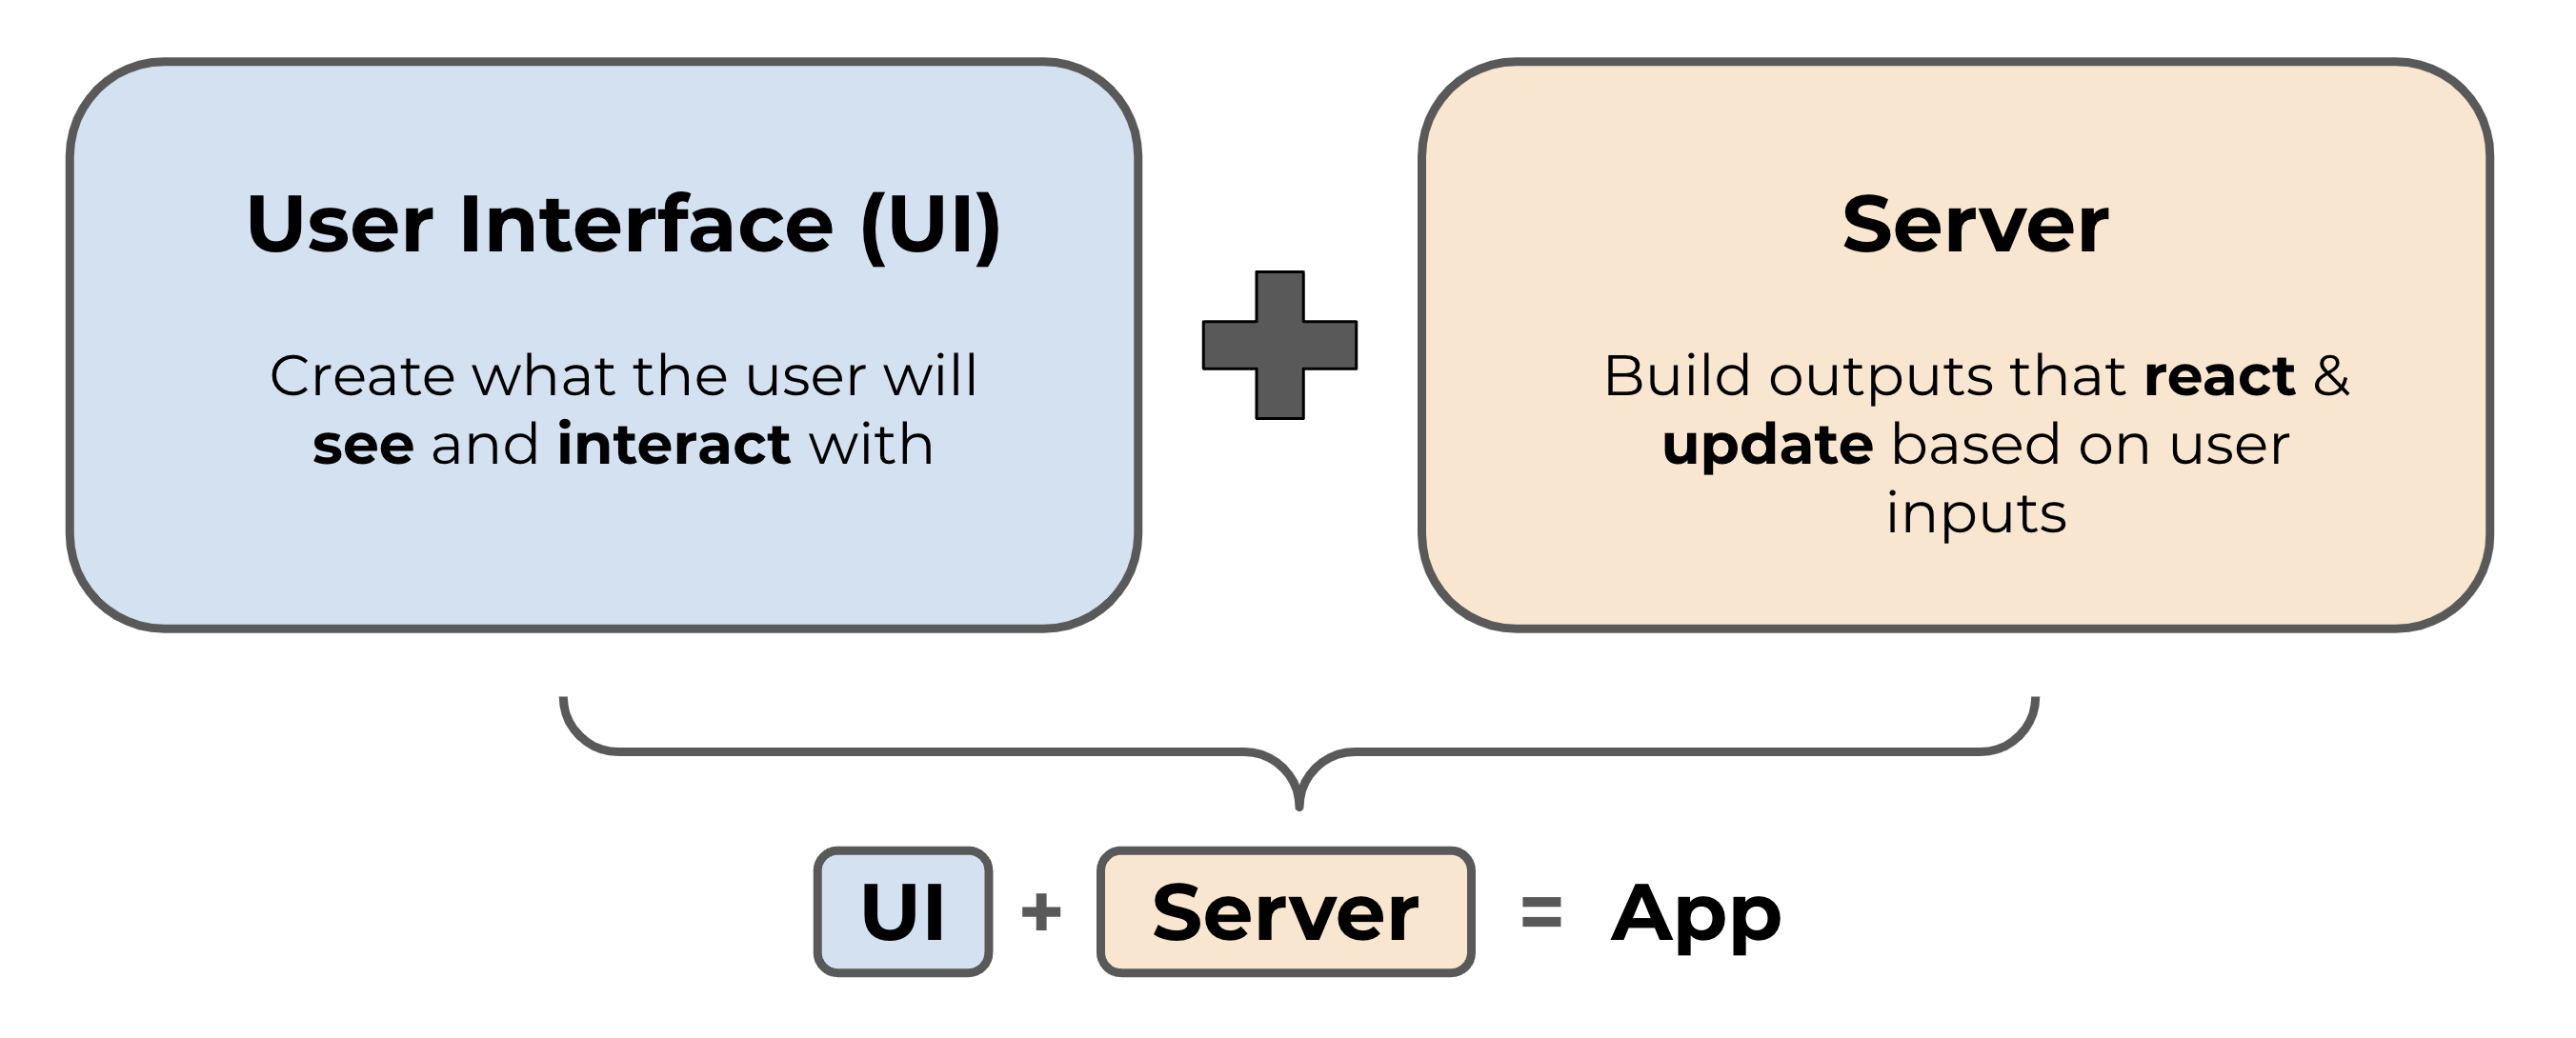
Shiny apps are composed in two parts: (1) a web page that displays the app to a user (i.e. the user interface, or UI for short), and (2) a computer that powers the app (i.e. the server)

A simple schematic of a Shiny app, which includes the User Interface (UI, colored in blue) and the Server (colored in orange). The UI creates what the user will see and interact with, while the server builds the outputs that react and update based on user inputs.

The UI controls the layout and appearance of your app and is written in HTML (but we use functions from the {shiny} package to write that HTML). The server handles the logic of the app – in other words, it is a set of instructions that tells the web page what to display when a user interacts with it.

Widgets are web elements that users can interact with via the UI


Examples of Shiny's pre-built widget options. These include buttons, single checkbox, checkbox groups, date input, date range, file input, numeric input, radio buttons, select box, sliders, and text input. The default color scheme is black and gray with selections highlighted in blue.

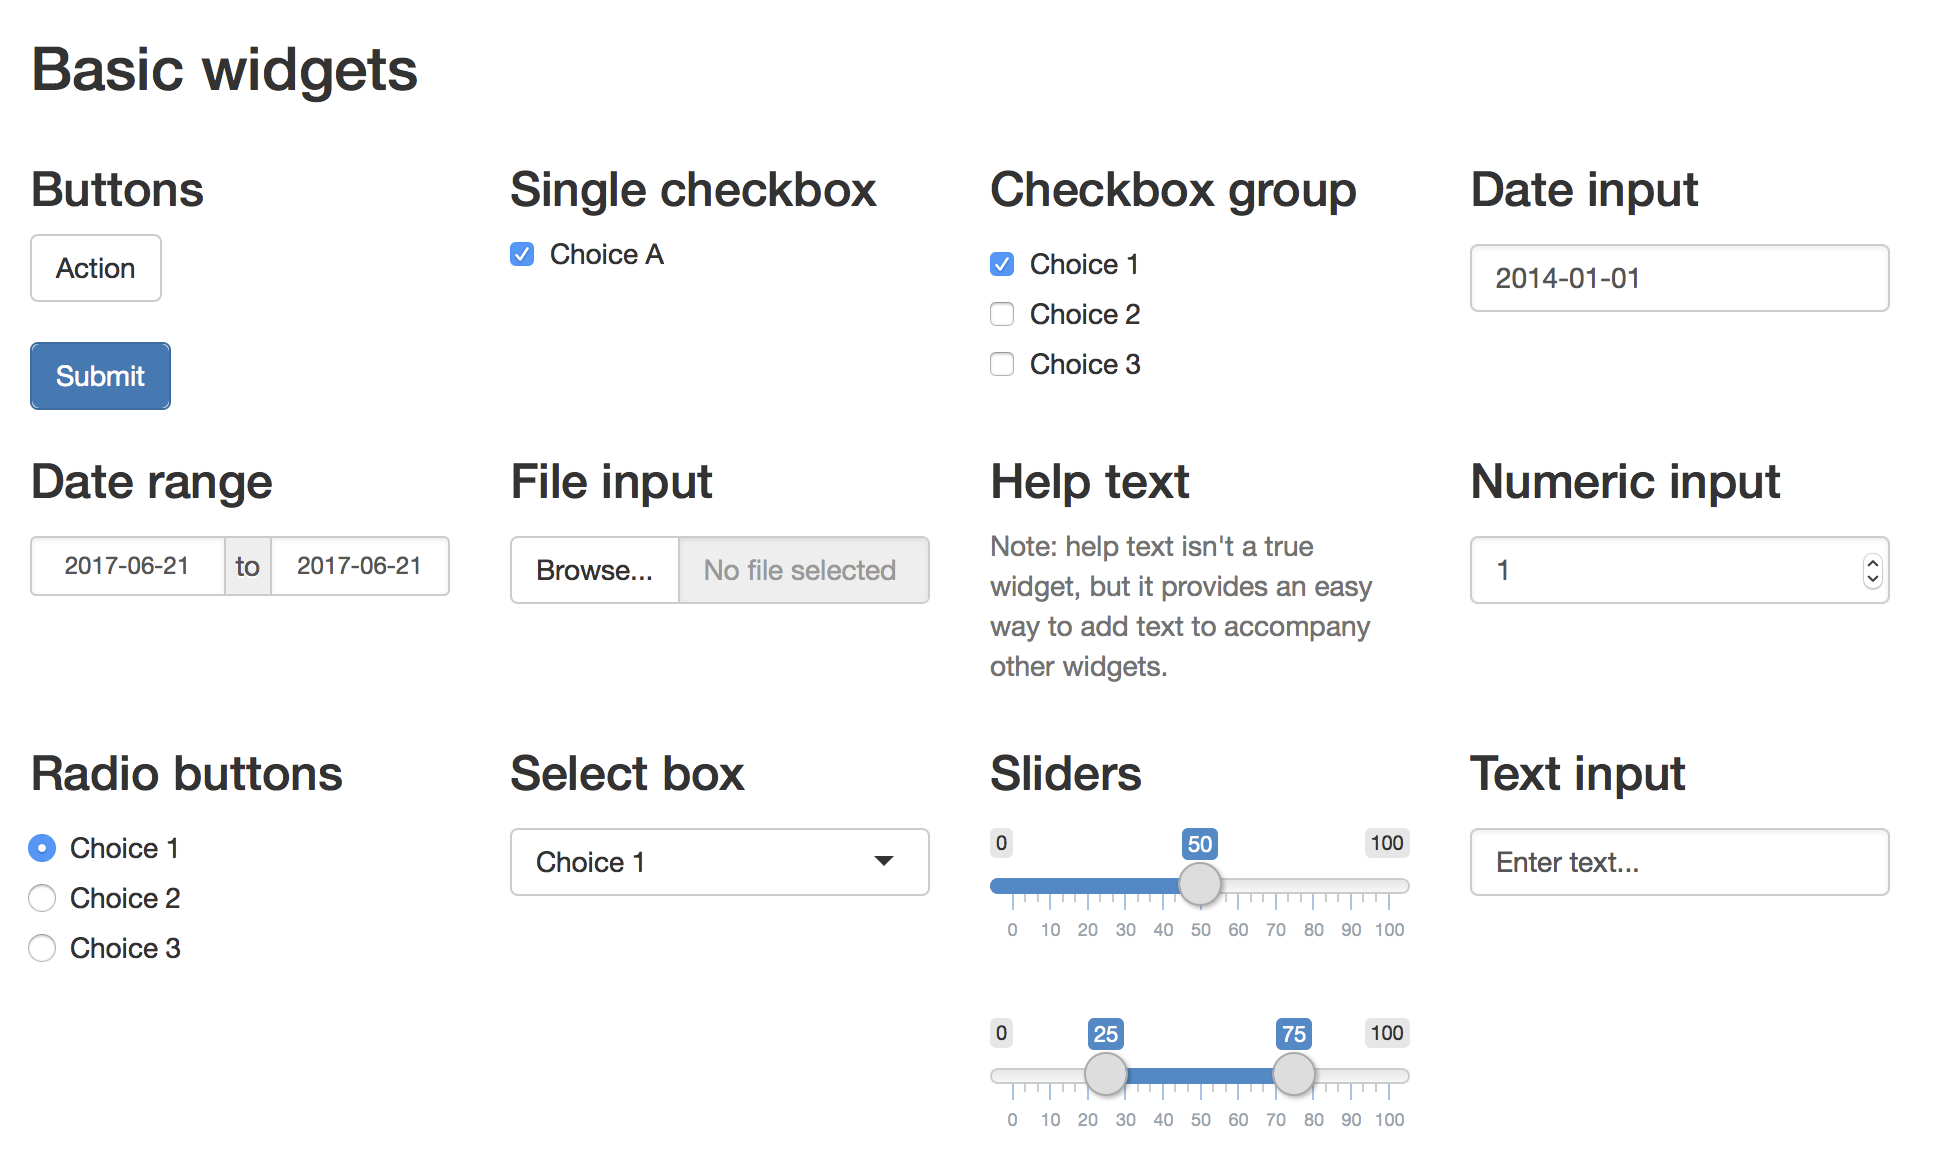
Widgets collect information from the user which is then used to update outputs created in the server.

Shiny comes with a set of of standard widgets (see left), but you can also explore widget extensions using a variety of other packages (e.g. {shinyWidgets}, {DT}, {plotly})

Reactivity: a brief intro


Reactivity is what makes Shiny apps responsive i.e. it lets the app instantly update itself whenever the user makes a change. At a very basic level, it looks something like this:

A schematic of Shiny reactivity. The UI is represented by a light blue box. Inside the blue UI box, there is a radio button widget that says, 'Make a choice:' and three round radio buttons beneath it. Underneath that, there is a placeholder space for a reactive output to be created by the server. The server is to the left of the UI and is represented by an orange box. At a basic level, reactivity occurs after the following steps: (1) A widget gets information from a user which (2) is then passed to the server where it is used to update a data frame based on the users choice. (3) The new data frame is used to update outputs in the server, and (4) those outputs are then rendered in the UI.

Check out Garrett Grolemund’s article, How to understand reactivity in R for a more detailed overview of Shiny reactivity.

Can I see an example please?

I’m glad you asked! There are lots of great examples online, including those developed by Bren alumni, as well as built-in teaching examples.

Example shiny apps (built by some familiar folks)


Live apps:

HydroTech Helper (video tutorial), by MEDS 2022 alumn, Daniel Kerstan, developed during his time as a USGS Hydrologic Technician – access real-time monitoring of USGS hydrology sites and equipment

Marine Mammal Bycatch Impacts Exploration Tool (source code) by Dr. Megsie Siple and colleagues – compute population projections under different bycatch mortality levels

Novel-gazing (source code) by Dr. Megsie Siple – a fun app for exploring your Goodreads data, inspired by community ecology


Apps which are no longer deployed:

Moorea Coral Reef LTER Shiny Application (source code), by MEDS 2022 alumni, Allie Cole, Felicia Cruz, Jake Eisaguirre & Charles Henrickson as part of their MEDS capstone project – visualize spatial and temporal patterns of coral reef stressors surrounding Moorea, French Polynesia

The Shiny packages comes with 11 built-in examples


Check out the available Shiny app examples by running this code in your console:

library(shiny)
runExample(example = NA)

Run the first example, which plots R’s built-in faithful data set with a configurable number of bins:

runExample("01_hello")

Change the number of bins using the sliderInput widget and watch the histogram re-render.

These working examples also come paired with source code for you to see how the app is built. For example, the sliderInput is built with the following code:

# Input: Slider for the number of bins ----
sliderInput(inputId = "bins",
            label = "Number of bins:",
            min = 1,
            max = 50,
            value = 30)

Now let’s build our own!

End part 1.1

Up next: building our own apps & dashboards

05:00